16 Crucial Social Media Metrics to Track In 2024
In a world where attention spans are already shorter than ever, understanding how your audience interacts with your […] The post 16 Crucial Social Media Metrics to Track In 2024 appeared first on SocialPilot.

In a world where attention spans are already shorter than ever, understanding how your audience interacts with your brand online is crucial. You need to know what works for your audience and what does not.
Looking at the likes and comments alone won’t work for long.
You need to know which social media metrics to track to tell the whole story and decipher hidden actionable insights.
These metrics are a data-driven compass that guides your social media strategy and shares invaluable insights into the audience’s behavior, content performance, and campaign effectiveness.
In this blog, we will walk you through some of the key metrics social media teams track to achieve their marketing goals. From engagement metrics to paid social metrics to customer support metrics, this resource guide has it all.
Let’s dive in and discover the metrics that truly matter.
What are Social Media Metrics?
Social media metrics are the key performance indicators (KPIs) that measure the success of your social media efforts. They provide valuable insights into how your target audience interacts with your content, how well your marketing campaigns perform, and how your social media strategy contributes to your overall business objectives.
By tracking the right metrics, you can make data-driven decisions to optimize your strategy, identify growth opportunities, and measure the return on investment (ROI).
Why Should You Measure Your Social Media Performance Metrics?
Nowadays, simply being present on social media isn’t enough. To truly leverage its full potential, you need to understand how your efforts are performing – and that’s where social media performance metrics come in.
Here’s why measuring
- Truth beyond likes: Likes and follower counts are like the tip of the iceberg, giving you a superficial view of the story. Metrics like shares, comments, and CTR reveal what content truly resonates with your audience, allowing you to optimize your content strategy for better engagement.
- Target the right audience: These metrics paint a clear picture of who’s interacting with your content. You can analyze demographics, interests, and behavior to be better aware of your audience. This empowers you to tailor your content and messaging to attract and engage the right people.
- Make ROI and data-driven decisions: Social media success goes beyond these vanity metrics. Tracking KPIs such as website traffic, lead generation, and conversions originating from social media helps you understand the true ROI of your social media efforts. With access to data, you can make decisions about resource allocation and optimize your campaigns.
16 Social Media Metrics That Businesses Always Look For
Every team has its business priorities; based on them, they curate their marketing strategy. However, there are always some key metrics that all social media marketers and businesses keep track of.
We have discussed the key metrics that you must consider during your analysis to keep your game up:
Social Media Engagement Metrics
Let’s start with the one metric every social media marketer or business looks at engagement rate.
Engagement rate is an umbrella term that indicates how well your social media content resonates with your audience on average. It essentially measures the percentage of users who view our content and take action, such as liking, commenting, sharing, retweeting, or clicking a link.
Average engagement rate
The average engagement rate is a metric that measures the total number of interactions your content receives relative to your total audience size. It offers insights into how well your content resonates with your audience by evaluating their engagement actions, such as likes, comments, followers, shares, and other interactions.
A high engagement rate pushes the social media algorithm in your favor by showing that the content is good and increases the chances of getting viral.
To calculate the average engagement rate, you need to divide total engagements by total followers and multiply by whole by 100.
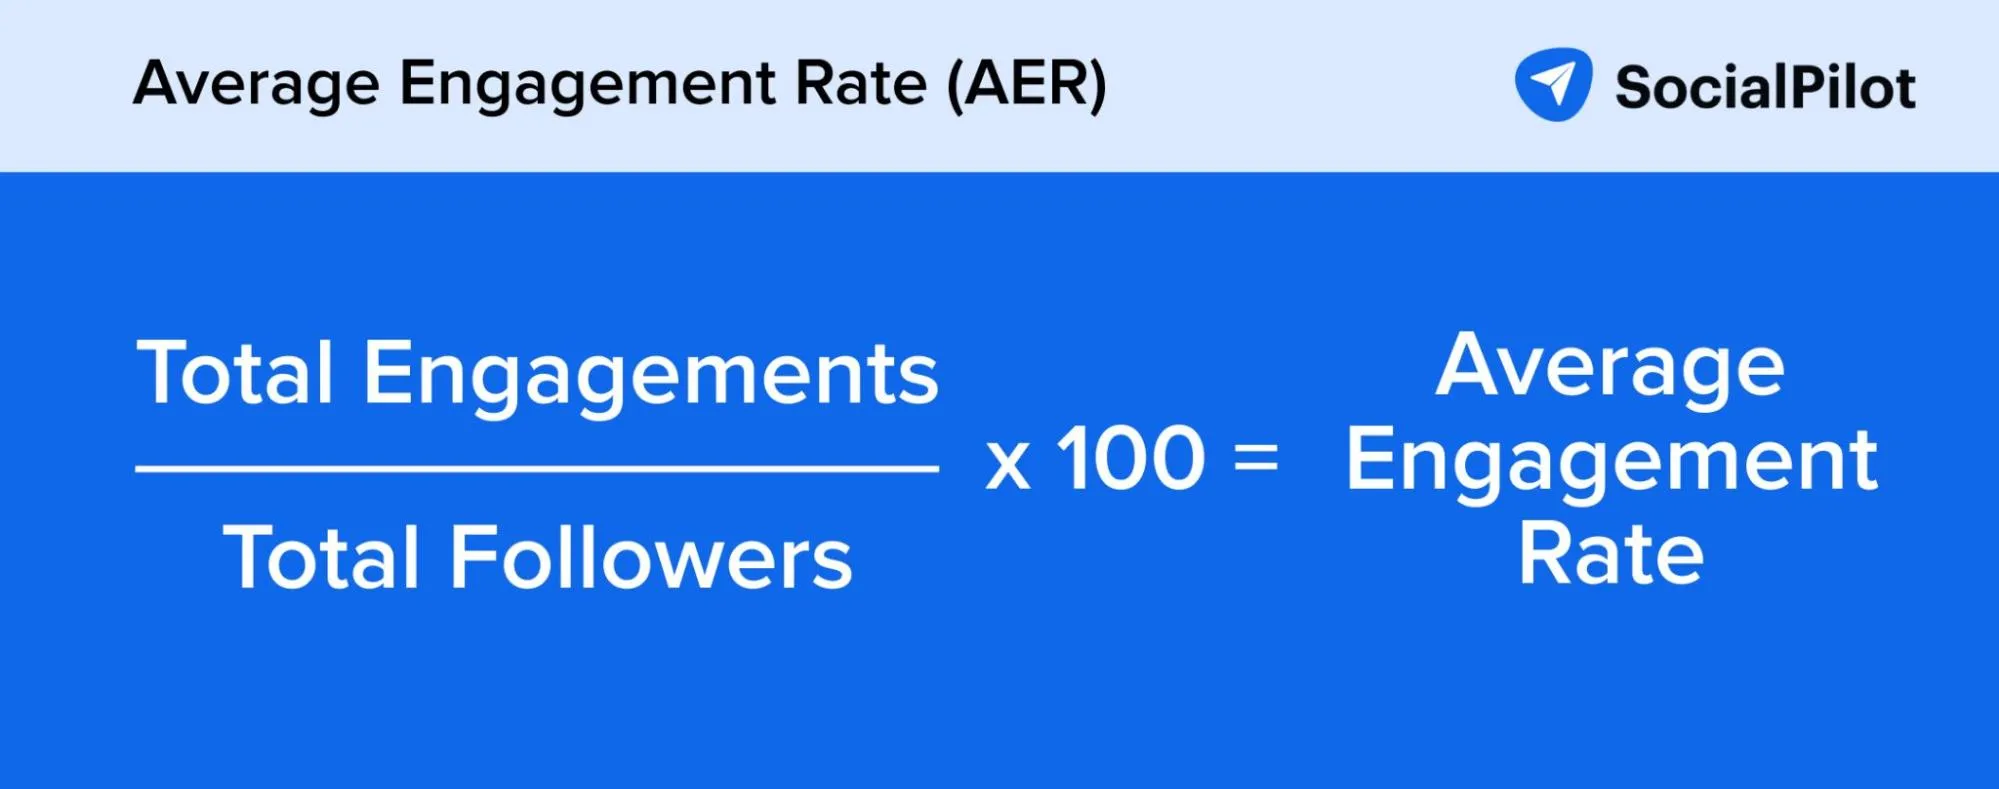
Where total engagements are the sum of all interactions (likes, comments, shares, etc.) on your content.
For example, if a post receives 150 likes, 50 comments, and 30 shares, and the total number of followers is 5000, the calculation would be:
Total engagements (150 + 50 + 30) divided by 5000 and multiplied by 100. It would be 4.6% in total.
For your reference, here are some social media benchmarks sores for engagement rate:
- Facebook post engagement rate: 0.018%
- Instagram post engagement rate: 0.90%
- X/Twitter post engagement rate: 0.05%
- TikTok post engagement rate: 2.65%
- LinkedIn post engagement rate: 0.54%
Likes, comments, retweets, etc
These metrics fall under the umbrella of social media engagement and give you valuable insights into what type of content sparks conversation and motivates users to take action. A high engagement rate refers to a healthy social media presence.
All this knowledge empowers you to refine your social media strategy and create content that sparks engagement and fosters a loyal community around your brand.
Virality rate
The virality rate is a metric that tells the extent to which your content is shared and spread across social media platforms, reflecting how quickly your content is gaining popularity among new audiences.
It provides insights into the effectiveness of your content in promoting users to share it with others and amplifying its reach beyond your followers.
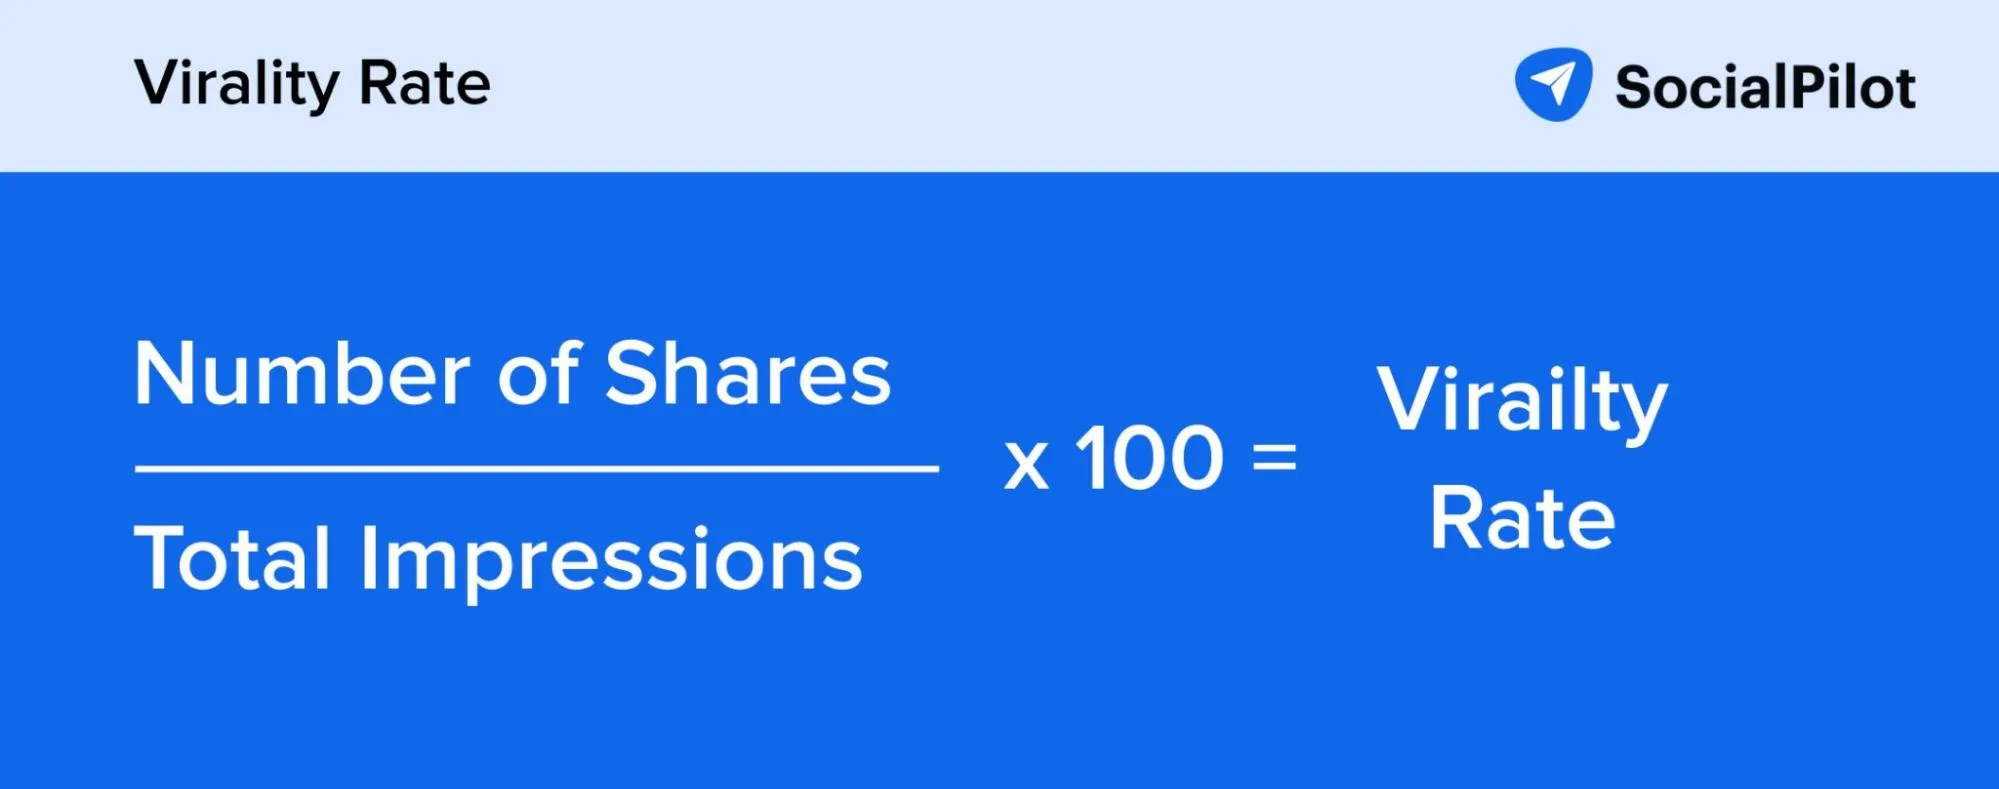
The virality rate is the total number of shares divided by total impressions multiplied by 100.
Applause rate
What’s an applause rate?
If you’ve never heard of this metric before, you aren’t alone. Your applause rate is the number of likes, favorites, or other approval actions on each of your posts.
Think about why you click “like” on someone’s Facebook post.
Regardless of whether it made you laugh, you think it imparts a good idea, or for some other reason, you decide to let the poster know that it has value to you.
Similarly, you can determine the value your posts provide to your audience. The more approval actions you get on your posts, the more value you’re providing to your audience.
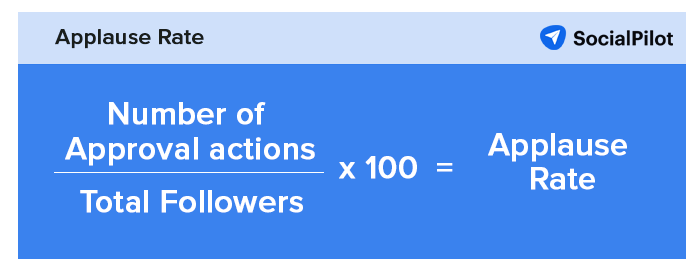
To calculate your applause rate, add up the number of approval actions on all your posts for a specific date or over a given period, divide by your total number of followers, and multiply by 100.
Social Media Audience Growth Metrics
Audience growth metrics reflect how your social media following is growing over time. They track the influx of new followers, subscribers, or loyal fans on your social media channels. By analyzing these, you can understand how effective your social media strategies are in attracting new people.
New followers
New followers represent the total number of new followers who started following our social media account over a specific period of time. This metric straightforwardly tells you how new users have decided to engage with our content and follow your updates. Tracking new followers helps you assess the immediate impact of your social media activities, campaign, and content strategies.
To track new followers of your profiles, you can use tools like SocialPilot, which gives you a comprehensive view of new followers over a specific time period.

Follower growth rate
The follower growth rate measures the percentage increase or decrease in the number of followers over a specific period.
The follower growth rate measures the increase or decrease in the number of followers over a specific period. It provides a more nuanced understanding of audience growth and helps identify growth trends and patterns over time, allowing you to plan better.
To calculate the follower growth rate, divide the number of new followers you gained across social media over a specific period of time by the total followers at the start multiplied by 100.

Social Media Awareness Metrics
Social media awareness metrics tell you how visible your brand or content is on social media platforms. They don’t necessarily measure direct interaction but rather focus on how many people your content reaches and the exposure you’re getting.
Impressions
Impressions are the number of times a post is displayed to someone. Impressions provide a good understanding of how much potential exposure your content and profile are getting.
Impressions are a valuable metric, but they’re just one part of the picture.
Combine them with engagement metrics such as likes, comments, and shares to understand how well your content resonates with your audience and motivates them to take action.
Reach
Reach goes a step further than impressions by focusing on the unique number of people who see your content. It eliminates the duplication of views from the same person and gives you a clear picture of how many individual users your content is reaching.
You can track the overall reach of your post/profile and break it down to understand what percentage of your audience is followers and non-followers.
PS: If you see a spike in non-followers seeing your content, algorithms love it.
Video views
Video views are the number of times a video has been watched on social media platforms. This metric provides insights into the reach and popularity of your video marketing efforts, helping creators and marketers understand how well their videos are performing in terms of gaining audience interest.
Brand mentions
Brand mentions track instances where your brand name or product is mentioned by other users on social media platforms. This shows organic brand awareness and whether people talk about you in their posts or comments without necessarily tagging you.
These mentions share valuable insights into organic brand awareness and reveal how people perceive your brand online.
Social Media Share of Voice Metrics
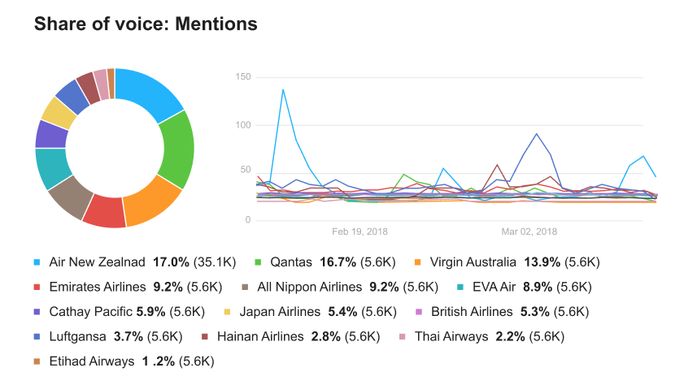
You want to outshine your competitors, right? Social Share of voice is how you know whether you’re succeeding.
This metric looks at your direct and indirect mentions vs. those of your competitors.
If you consistently have more, then your social media efforts are more successful than your competitors. Calculating your social share of voice isn’t difficult.
Track your mentions and those of your competitors over a specific period. Add the two together, and then divide yours by that total. Multiply by 100, and that’s your social share of voice.
Social Media Advertising Metrics
When it comes to advertising campaigns, paid social media metrics are the key performance indicators (KPIs) used to track the effectiveness. These metrics give you a detailed view of your paid ads’ performance and whether they’re reaching the right target audience.
Here are some of the core metrics you should be tracking:
Click-through rates (CTR)
Click-Through Rate (CTR) is a metric that measures the percentage of users who click on a call-to-action (CTA) in your social media post, email, advertisement, or other digital media content.
It shows you how effective your content is in driving user engagement and directing users to the desired destination. It may be a website, landing page, or an online Shopify store looking to drive sales.
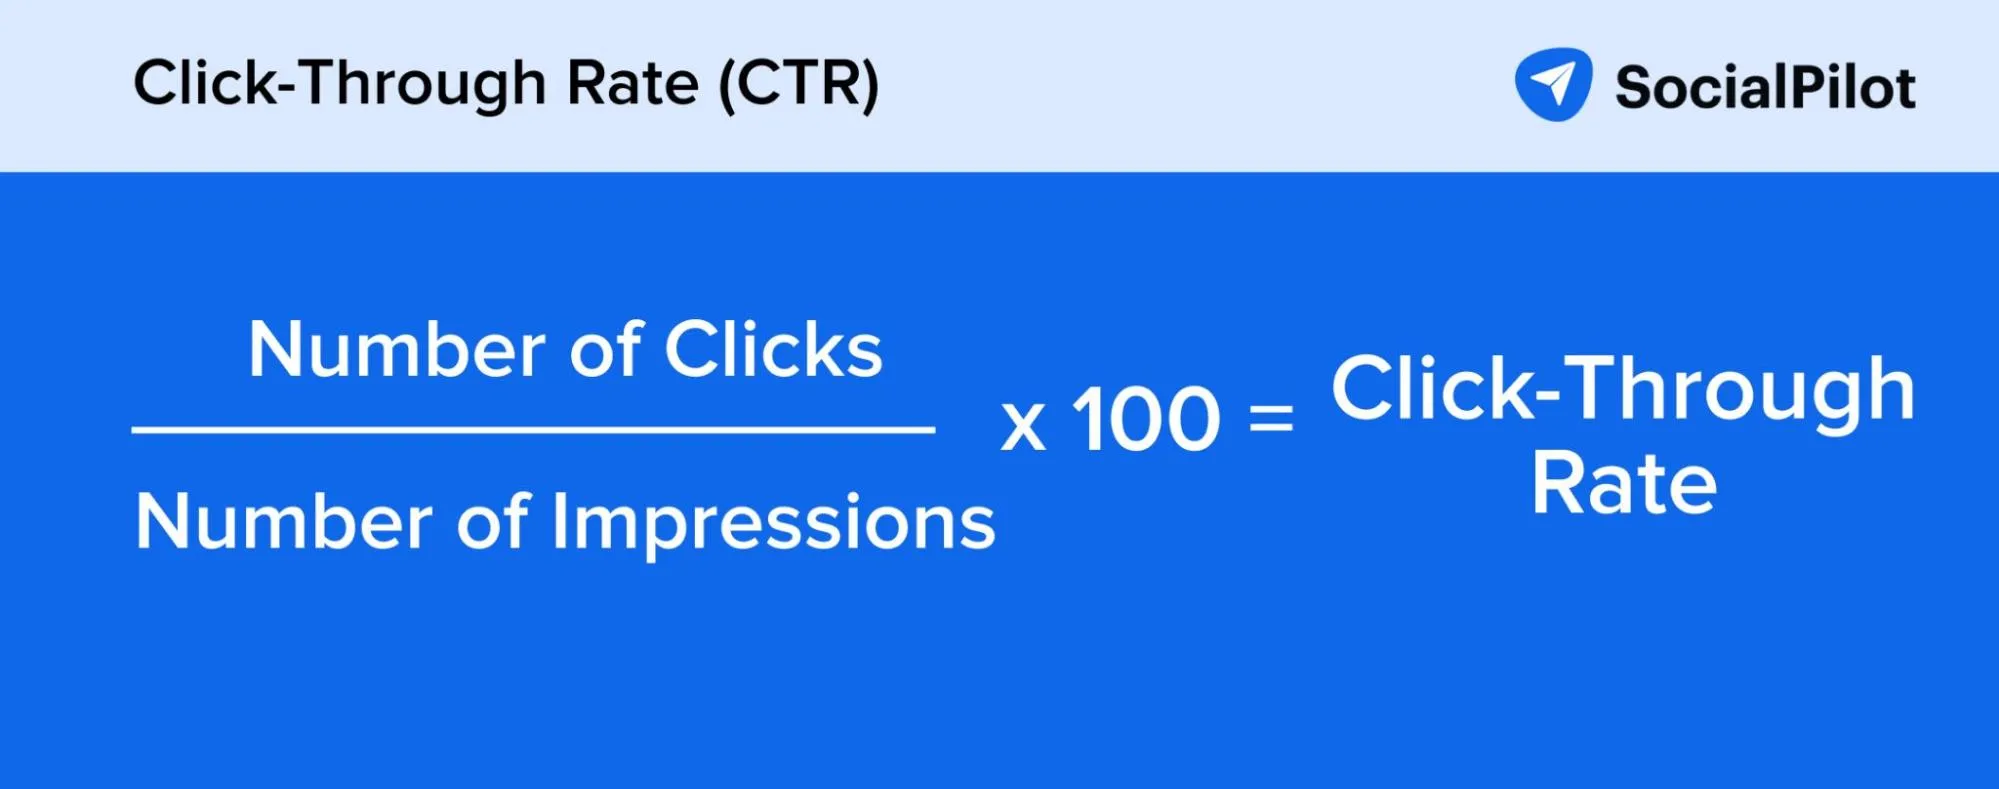
To calculate CTR, divide the total number of clicks of a post by the total number of Impressions and multiply by 100 to get a percentage.
Cost per click (CPC)
The cost per click is the amount you pay each time someone clicks on your advertisement. For instance, if you’re running paid advertisements on Facebook, your cost per click is the amount you pay Facebook for each click on your ad.
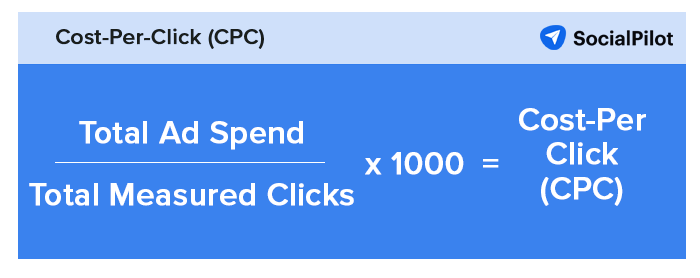
Most businesses devote much of their operating budget to advertising and marketing. Since you’re likely to advertise across several platforms, you might be tempted to look at your total spending.
In that case, you have a more difficult time determining whether your advertising efforts on each platform are worth the money you’re spending on each platform. Your CPC is a far better metric for that than your total amount spent.
You must check each platform’s ad manager to see your CPC. Be sure to check it often.
Conversion rate
Conversion rates are one of the most prominent metrics most companies track because they tell you how much revenue your social media marketing is generating.
Your conversion rate is the number of people who take some kind of action on your page divided by your page’s total visitors.
Those actions can include things like:
- Clicking on your website link or another link of yours
- Subscribing to your newsletter
- Registering for an event
Your conversion rate is so important that social media platforms themselves, along with analytics software, tend to put them front and center in your metrics.
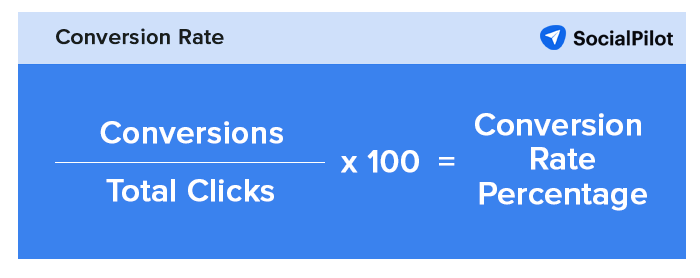
They do that because your conversion rate is the starkest illustration of how valuable your audience thinks you are. If you’re getting many visitors but few conversions, you know it’s time to change your strategy.
Return on ad spend (ROAS)
ROAS tells you how much revenue you generated for every dollar spent on advertising. ROAS is particularly useful for evaluating the efficiency of online advertising campaigns, such as on Google Ads, Facebook Ads, and other ad platforms.
This provides you actionable insights into which ads and strategies are performing the best, driving maximum results and ensuring ad spending contributes positively to the bottom line.
Here is how you can calculate ROAS: Divide the revenue from ads by the cost of ads.
Let’s understand this with an example: You spend $1200 on a social media ad campaign, and it generates $3600 in revenue. Your ROAS would be:
ROAS = $3600/$1200 = 3
Cost per thousand impressions (CPM)
The cost per thousand impressions, or CPM, measures the cost of one thousand advertising impressions on a social media platform or a webpage. It is a common pricing model used for digital advertising and helps advertisers understand the cost-effectiveness of their campaigns in terms of reach.
Social Media Customer Service Metrics
Customers are at the heart of any business, and not paying attention to their issues and problems can be a catastrophe for your business. Customer service metrics help you deal with these troubles by providing valuable insights into how well your team resolves customer issues, meets expectations, and ultimately fosters loyalty.
Here’s a breakdown of the different metrics:
Average response time
The average response time is a metric that refers to the average amount of time it takes your team to reply to customer inquiries. This key metric measures the efficiency of your customer service and the responsiveness you offer to your loyal consumers.
Don’t get it?
Let’s understand this with an example: Your customer service team receives 200 inquiries weekly. The total time to respond to all queries is 400 hours.
Average response time: 400 hours/200 inquiries = 2 hours
Here, the average reply time to a customer inquiry is 2 hours, which your team takes on average.
Customer satisfaction score (CSAT)
Do you think your job is done after responding to your customers’ inquiries?
Well, thats not always the case.
You need to understand whether your customers liked your customer service or not. How satisfied are they, and do they have any prompt feedback for you?
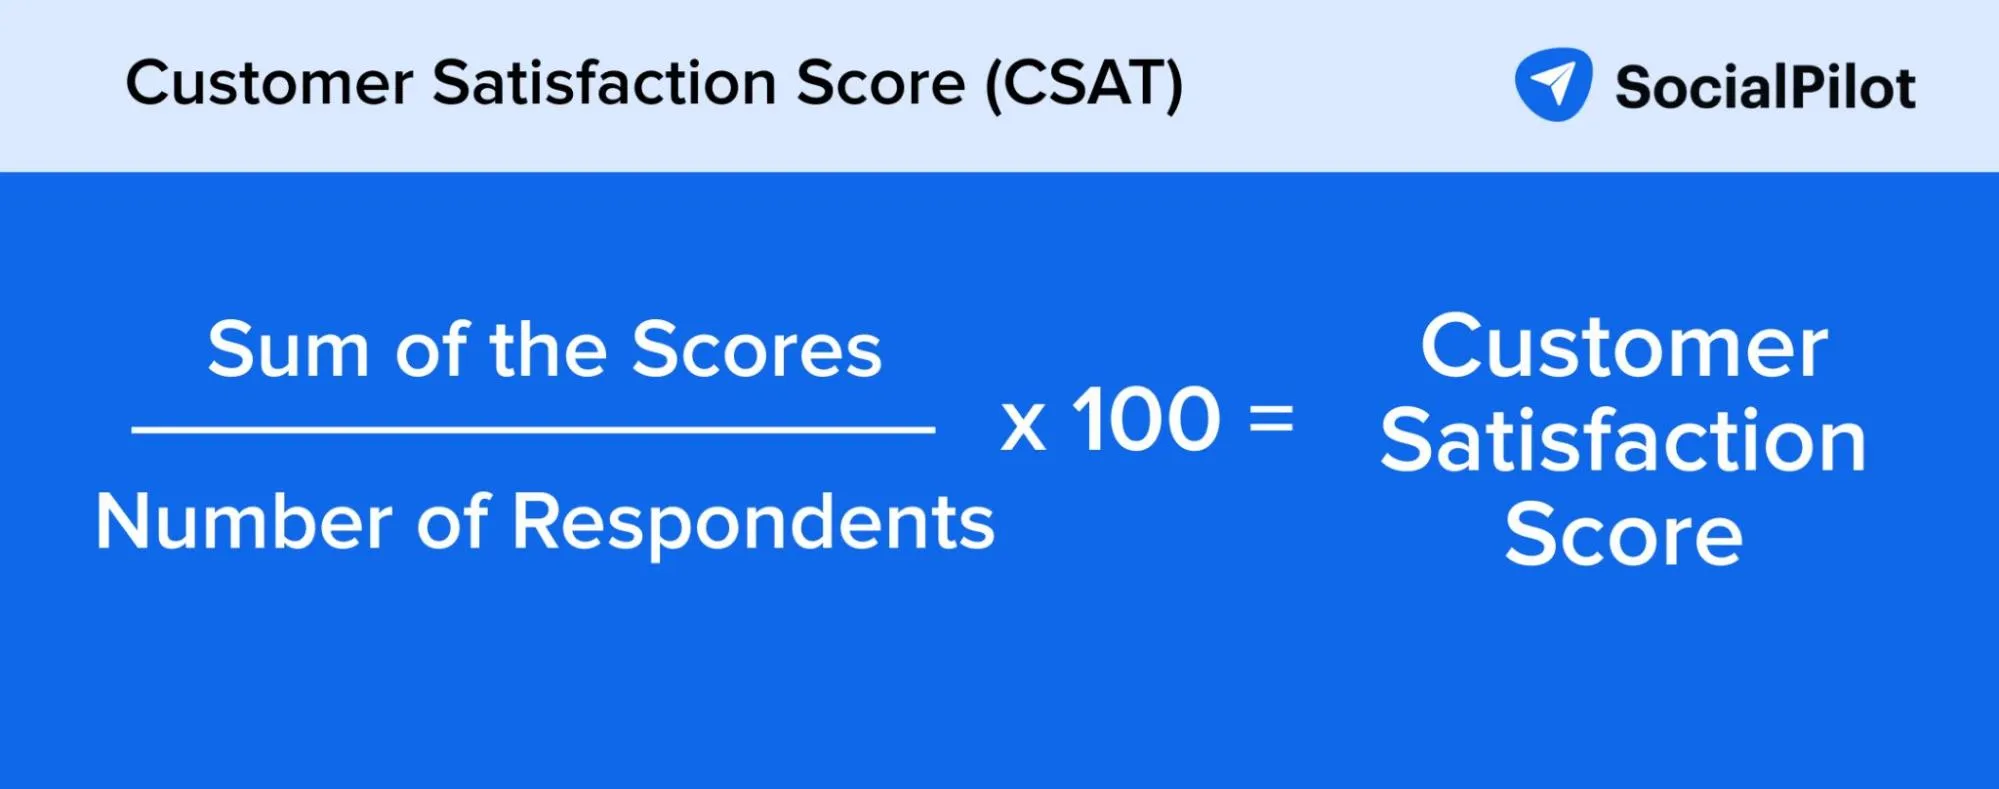
Customer Satisfaction Score (CSAT) is a metric that measures how happy your customers are with your service through surveys and ratings after an interaction.
Here is how you can calculate this:
It is the sum of the score divided by the number of respondents multiplied by 100.
Net promoter score (NPS)
Net promoter score is another metric used to gauge customer loyalty and the likelihood of recommending your product or brand to others. It’s a single-question survey that offers a quick and insightful way to track customers’ sentiments toward your brand.
The NPS Question:
The core of NPS is a single, standardized question:
“On a scale of 0 to 10, how likely are you to recommend [Your Business] to a friend or colleague?“
Based on their ratings (0-10), customers are categorized as follows:
- Promoters (9-10): These are your loyal customers who are highly likely to recommend your business or product and promote it positively.
- Passives (7-8): These customers are somewhat satisfied but not necessarily enthusiastic brand advocates.
- Detractors (0-6): These dissatisfied customers may discourage others from trying out your business.
Here’s how you can calculate the NPS:
NPS = (Promoters – Detractors) / Total respondents x 100
Here is an example:
Let’s say you surveyed 100 customers and received the following responses:
Promoters (9-10): 30%
Passives (7-8): 40%
Detractors (0-6): 30%
Your NPS = 30% (Promoters) – 30% (Detractors) = 0
In this example, your NPS score is 0, indicating that your customer base has a balanced percentage of promoters and detractors.
How to Track Social Media Metrics?
There are several ways to measure your social media efforts. The simplest one is to look into each platform’s native analytics section.
While you can see the analytics section of Facebook, Twitter, and LinkedIn by default on their native platforms, you will need a business account to get the analytics of Instagram, Pinterest, and TikTok—which hopefully you already have.
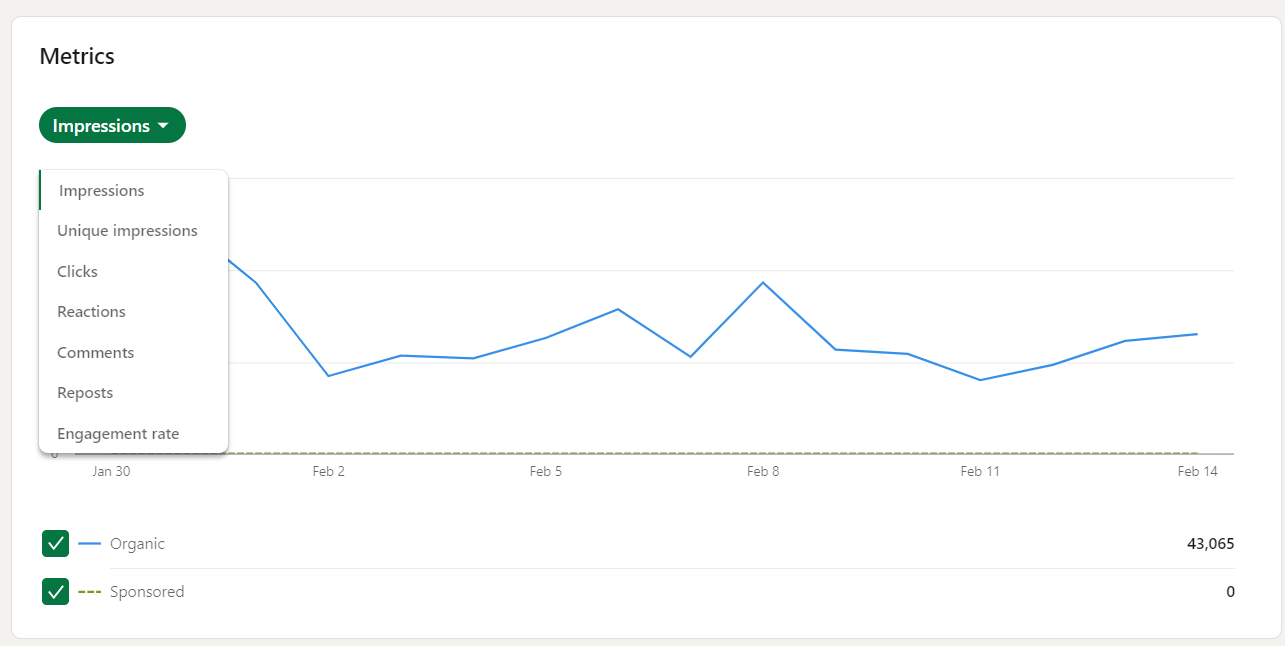
When you are on a low budget and have only an individual social account to manage, it’s worthwhile to track your most crucial metrics through native platforms.
However, things can become pretty hectic for a social media manager handling multiple clients’ accounts across various platforms.
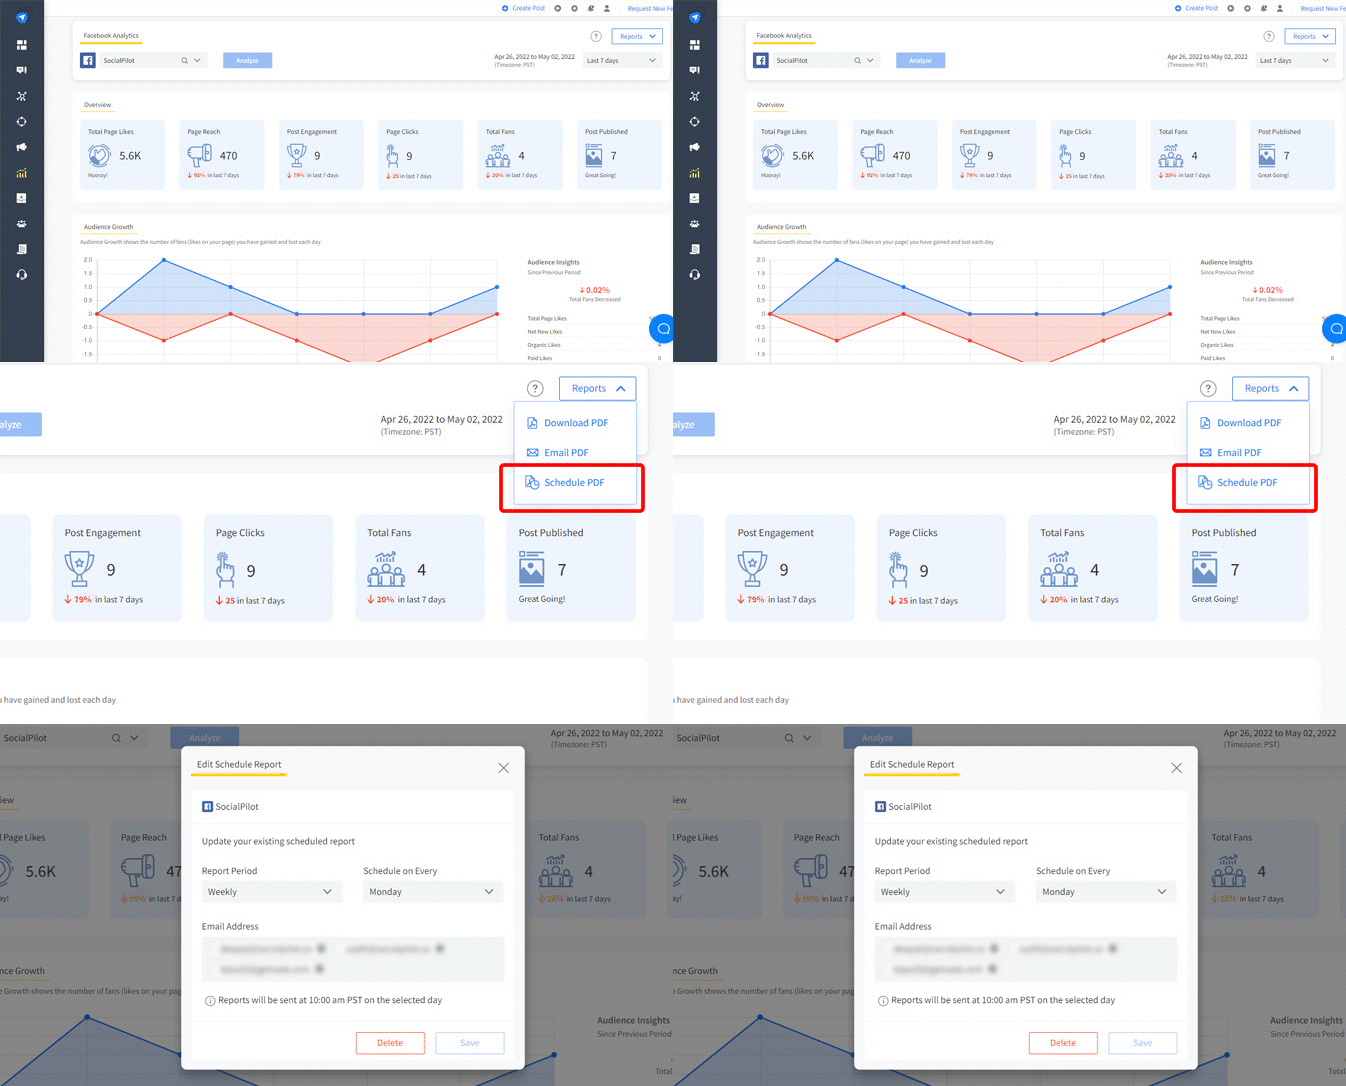
In such cases, the easiest method involves using a social media analytics tool like SocialPilot, which enables you to see the metrics of every major social media platform.
With SocialPilot, you can easily filter multiple social accounts from a single page and get updates on posts, engagement, reach, and audience insights.
Do you dread sending monthly social performance reports manually to different clients? Sending reports manually is a thing of the past, anyway.
Use SocialPilot to download or schedule your report in advance and share it automatically later with clients and teammates. The report-sharing feature saves you much time by automatically pulling and sharing key metrics. It ends your repetitive turmoil of remembering and sending the performance report to clients and stakeholders.
Now that you know where to start tracking your social media analytics data, it is time to figure out what you social media metric you need to track.
Sometimes, with so much information at your disposal, it’s hard to decide which metric to track consistently.
Hence, we have compiled a list of must-track social media metrics to ease your efforts.
Wrapping Up
Whenever you post on social media on behalf of your business, you should use all of the above metrics. Now that you’re familiar with CTR, CPC, AER, and other social media metrics to track, you can start to analyze what numbers are good for your brand.
By tracking these vital social media metrics over time, you’ll identify your own brand’s baseline stats before the dynamic trends emerge. The next step is to use them to understand what changes to make to better engage with your users.
Ultimately, if you track these metrics and change your social media strategy accordingly, you’ll get a much better return on your investment and grow your business.
The post 16 Crucial Social Media Metrics to Track In 2024 appeared first on SocialPilot.
What's Your Reaction?


